The REMOVEFILTERS function returns all the rows in a table or all the values in one or more columns, ignoring any filters that have been applied.
REMOVEFILTERS(
table
)
REMOVEFILTERS(
column
[, column[, ...]]
)
- table: Name of the table for which you want to remove the filters applied.
- column: Name of the columns for which you want to remove the filters that have been applied.
The REMOVEFILTERS function does not return any results.
Suppose we have in our report -among other visualizations- a slicer by country, and suppose we also want to include a card-type visualization that shows the total sales (the absolute total, without considering any filter). For this card we create a measure that simply adds the Amount field that contains the amount of each sale:
Total Sales = SUM(Sales [Amount])
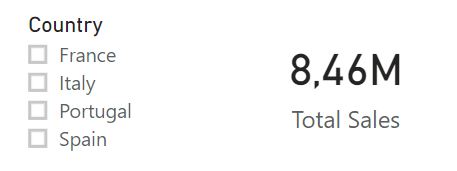
The visualizations -if we do not select any country in the slicer and assuming that no other filter is being applied- show the following aspect:
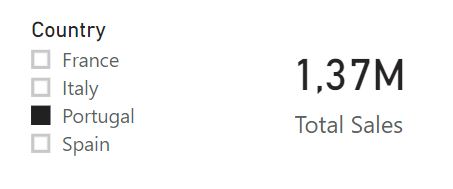
Now, if a selection is made in the slicer, by default our total sales figure will be contextualized -which, as mentioned, is not what we want-:
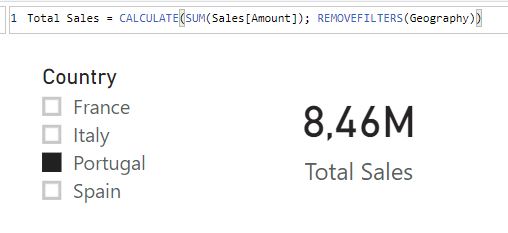
To avoid this contextualization, we can use the CALCULATE function to eliminate all existing filters by adding the REMOVEFILTERS function as an argument:
Total Sales = CALCULATE(SUM(Sales[Amount]), REMOVEFILTERS(Geography))
Now, the expression SUM(Sales[Amount]) will be calculated for all the rows of the Geography table regardless of the selection we make in the slicer: