The ALLSELECTED function removes filters coming from the rows and columns of the visual object where the measure is located, leaving the other context or explicit filters in place.
ALLSELECTED(
tableName
)
ALLSELECTED(
columnName
[, columnName...]
)
ALLSELECTED()
- tableName: Name of the table to consider.
- columnName: Name of the column to consider, normally fully qualified.
The ALLSELECTED function returns a table.
The ALLSELECTED function can be used to obtain the totals of the visible fields in the queries. It is generally used as an argument in a CALCULATE function to enforce visible items as a filter. The function can be used without arguments or with one or more arguments.
We define the following measure to calculate sales totals (value that will be contextualized in each calculation):
Ventas netas = SUM(FactInternetSales[SalesAmount])
And the measure:
Ventas netas para meses seleccionados = CALCULATE(
[Ventas netas],
ALLSELECTED(DimDate[MonthNumberOfYear])
)
Now, if we take the DimDate[MonthNumberOfYear] field to the row area and the two measures created to the value area of a pivot table, we obtain the following result:
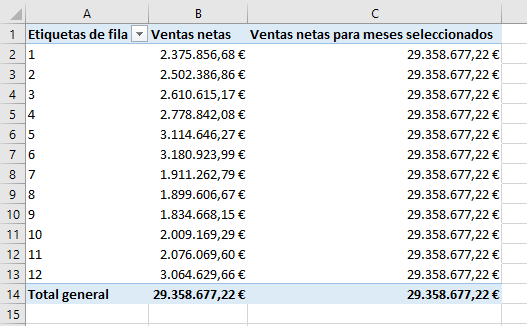
We see that, by default, the totals of both measures coincide.
If we now filter the values located in rows to show only information about some of them (for example, for months 4, 5 and 6):
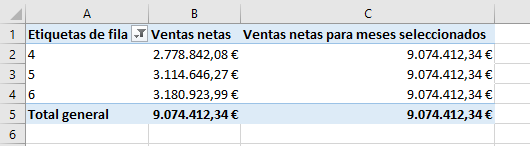
We can see how the values in column C consider only the months that have been selected as a filter.
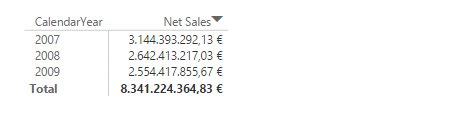
This second example is similar to the previous one but in the Power BI Desktop environment. We start from the definition of a measure that adds sales:
Net Sales = SUM(FactSales[SalesAmount])
measure that, taken to a "matrix" type display with the years in the row field and the newly created measure in the value field, returns the result shown in the following image:
We now define the following measure, making use of the ALLSELECTED function:
Net Sales Selected Years = CALCULATE(
[Net Sales],
ALLSELECTED(DimDate[CalendarYear])
)
If we take this measure to a matrix similar to the previous one, we obtain:
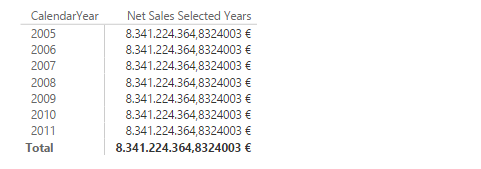
It can be seen how, since all the years are selected by default, the value of the measure for each of the years coincides with the total sales. If we now impose an explicit filter in the Power BI Desktop interface to show information only for the years before or equal to 2008:
we obtain:
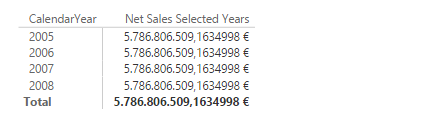
value that matches the sum of sales for the years being displayed on the screen.
Continuing with the previous example, how would the ALLSELECTED function work without references to tables or columns? Let's define the following measure:
AllSelected = CALCULATE([Total Sales], ALLSELECTED())
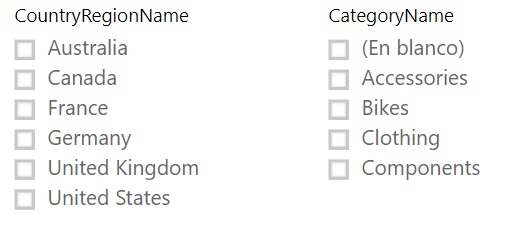
We create a new segmentation for the category and reinitialize both:
Let's now take the newly created measure to a matrix similar to the previous ones:
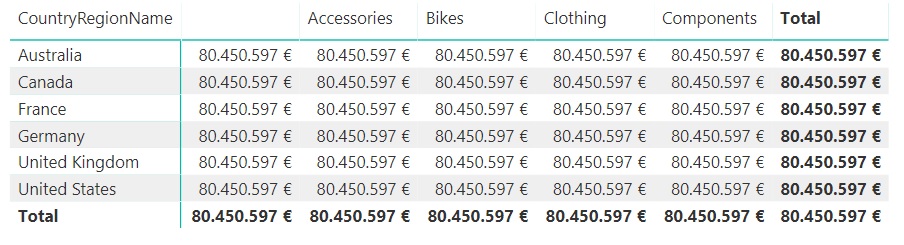
(note the existence of a first column corresponding to sales records that do not have an associated category).
We verify that the ALLSELECTED function is forcing the row and column filters to be ignored, the sales of all countries and all categories are considered in the calculation of the measure and the context imposed "externally" is considered -context that, in this case, does not exist, as we have not yet made any selection in the data slicers-. This makes the result of the measurement calculation always coincide with the total sales: € 80,450,597.
Let's now select a country, Canada, for example:
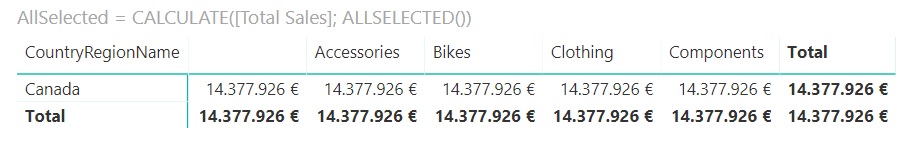
Only the row for Canada is shown and, following the same idea, for the calculation of the measure the row and column filters are still ignored and only the external ones are considered: Canada. In other words, Canadian sales are being recorded for all categories: € 14,377,926 (total Canadian sales).
If we select the category of Bikes, for example:
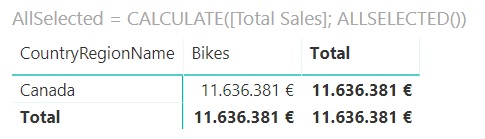
Now only one row (the one for Canada) and one column (the one for Bikes) are shown, and the value returned by the measure is the result of bypassing the row and column filters and considering only the external ones. In other words, the Bikes sales figure for Canada is always returned.
Let's now select two countries (Canada and Australia) and two categories (Bikes and Clothing). The result is as expected:
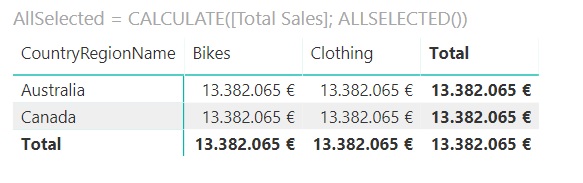
The two rows and two columns are displayed, and the result always coincides with the total sales of the two countries and the two categories (which we can check by adding the corresponding figures in the first of the matrices shown in the previous example).
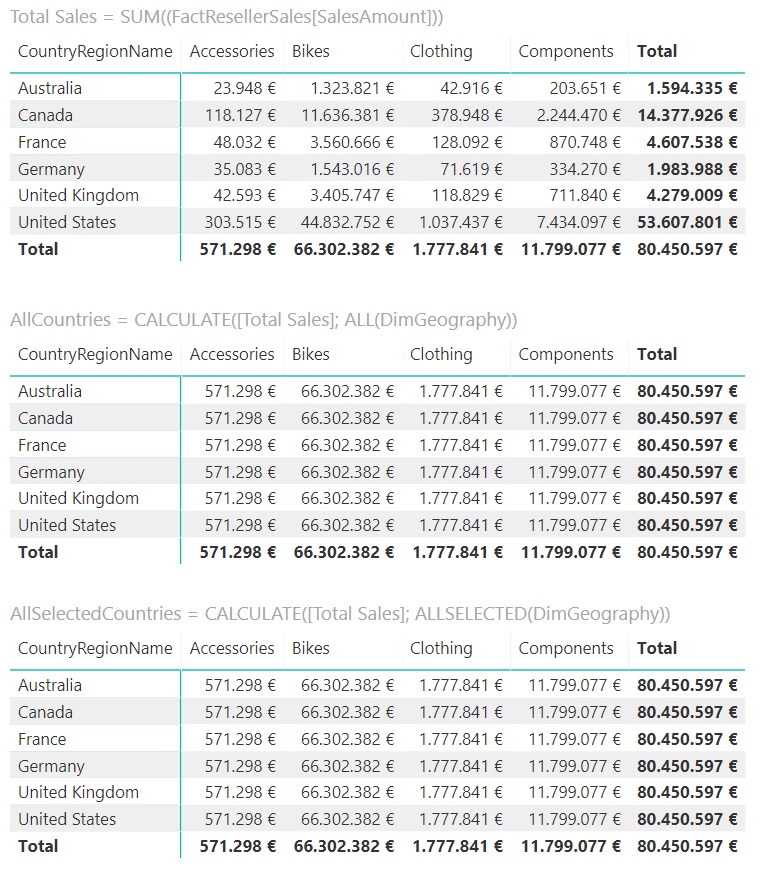
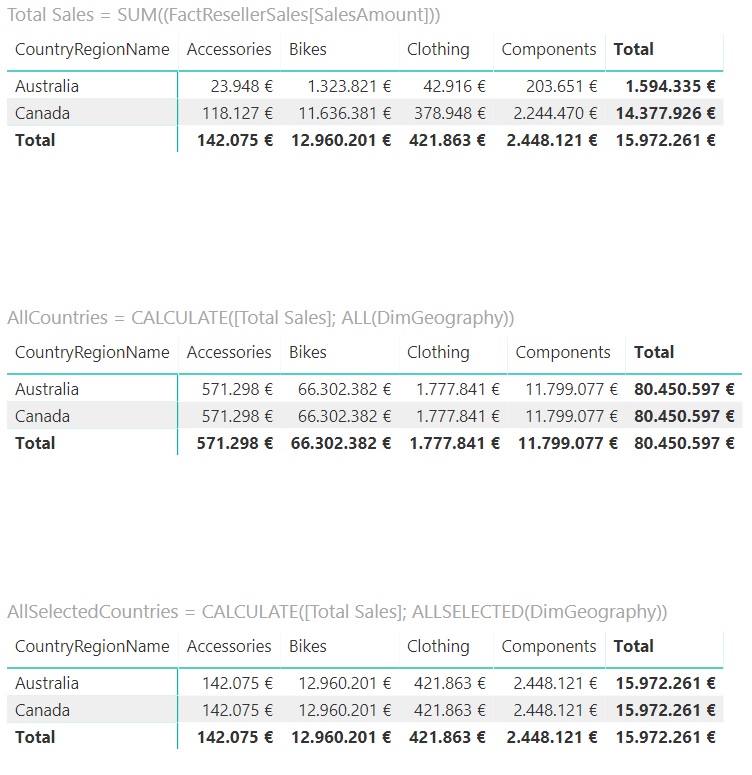
We can compare ALL functions and ALLSELECTED as follows: We start from a measure [Total Sales] that adds the sales column:
Total Sales = SUM((FactResellerSales[SalesAmount]))
And we add two additional measures:
AllCountries = CALCULATE([Total Sales], ALL(DimGeography))
AllSelectedCountries = CALCULATE([Total Sales], ALLSELECTED(DimGeography))
We now take these three measures to two matrices in which we cross the sales by country and category:
Additionally we create a data segmentation for the countries:
The ALL function of the [AllCountries] measure returns the entire table of countries (in this specific case, not only the entire column of countries, but the entire table with the geographic information). This means that, in each row of the second matrix, the filter imposed by the country corresponding to the row is ignored and the calculation is made for all countries (giving, for the accessories category, for example, the same figure, 571,298 €, a figure that coincides with the total sales of that category).
The ALLSELECTED function also returns the entire table "except for external filters" which, in this case, do not exist. That is why we see that the third matrix coincides with the second.
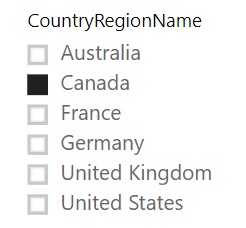
Let's now select a country in the data segmentation. For example, Canada:
Let's see what information our matrices now show:
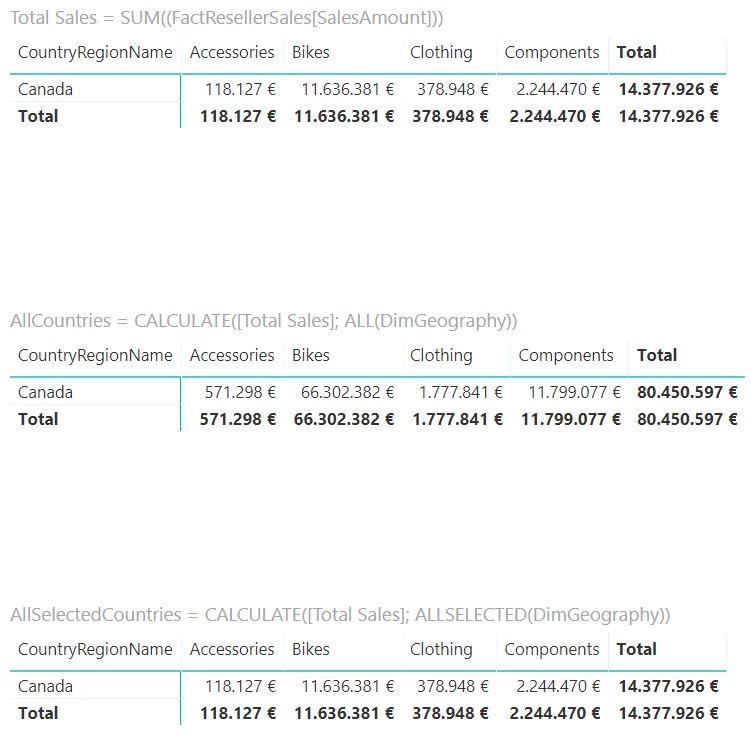
First of all, we see that all three are now showing only the row corresponding to Canada, as it should be. The first matrix shows the sales data in Canada for each category, the same figures we had before selecting a country.
In the second matrix, the ALL function continues forcing the calculation of the measure considering all countries (and ignoring the filter of the country to which each row corresponds). In other words, for the accessories category, for example, it still shows € 571,298 of sales, a figure that coincides with the total sales of this category for all countries. That is, the information displayed in this second matrix has not changed (for the rows that are displayed).
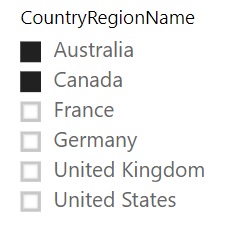
The third matrix, however, has changed. The ALLSELECTED function is forcing the context imposed on each row of the matrix to be ignored (that is, to ignore that the row shown corresponds only to Canada), and to consider only "externally selected countries" which, in this case, is only Canada. That is, in this case, it shows the correct data for Canada. But, if in the data segmentation, we select a second country:
we see that this third matrix shows different information:
Of course, the three matrices now show the rows corresponding to the two selected countries, Australia and Canada: the first matrix shows the correct sales for each category in each country and the second matrix continues to calculate the measure including information for all countries.
In the third matrix, however, the criterion remains the same as before: for the calculation of the measure, ignore the context imposed -in this case- by the country to which each row corresponds and consider the externally imposed context that, In our example, it includes the two countries mentioned. That is why, regardless of the country to which each row corresponds, the measure coincides with the sum of sales of both countries.