The ALL function returns all the rows in a table or all the values in one or more columns, ignoring any filters that have been applied.
ALL(
table
)
ALL(
column
[, column[, ...]]
)
- table: Name of the table whose rows you want to extract.
- column: Name of the columns whose rows you want to extract.
The ALL function returns a table.
The ALL function is useful for performing a calculation that affects all rows in a table regardless of the context of the calculation. It is usually used as an intermediate function in a calculation (usually as an argument in a CALCULATE function) to modify the set of rows on which it is to be performed. In practice -used as an argument in a CALCULATE function- it removes the filter from the context.
Both table and column arguments must be references to a table or to columns. You cannot use expressions that return a table or column.
The operation of this function depends on the syntax that is being used:
- If a table is being included as an argument, the ALL function returns the entire table, regardless of the filters that were being applied.
- If one or more columns is being included as an argument, the ALL function returns the unique values of the column or columns in question, ignoring the filters that were being applied, in table format. All columns included as arguments must come from the same table.
Suppose that in a sales table the column SalesAmount is included with the sales amounts. If we want to include in a report a visualization that includes the breakdown of sales by subcategory, we could do so by creating a measure that adds up the sales:
Ventas = SUM(FactSales[SalesAmount])
...and creating a "table" type display with the ProductSubcategoryName field and the newly created measure:
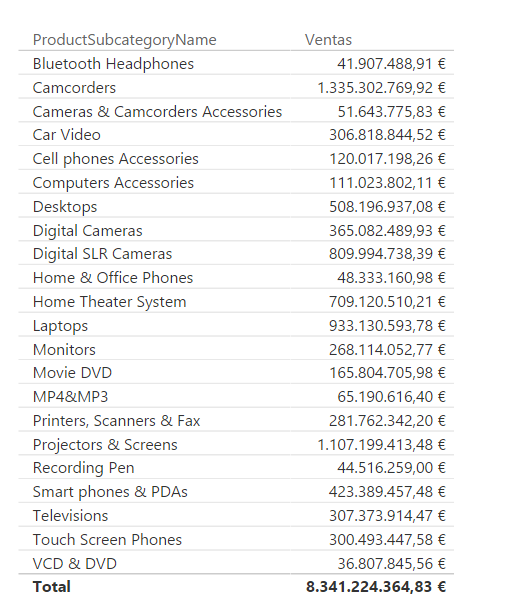
As you might expect, the measure is context-specific by including, for each sub-category, only the appropriate rows.
However, if we wish to calculate the percentage that each of these figures represents with respect to the total (dividing each figure by the total sales), the creation of a measure of the type:
Ventas % = DIVIDE([Ventas], SUM(FactSales[SalesAmount]))
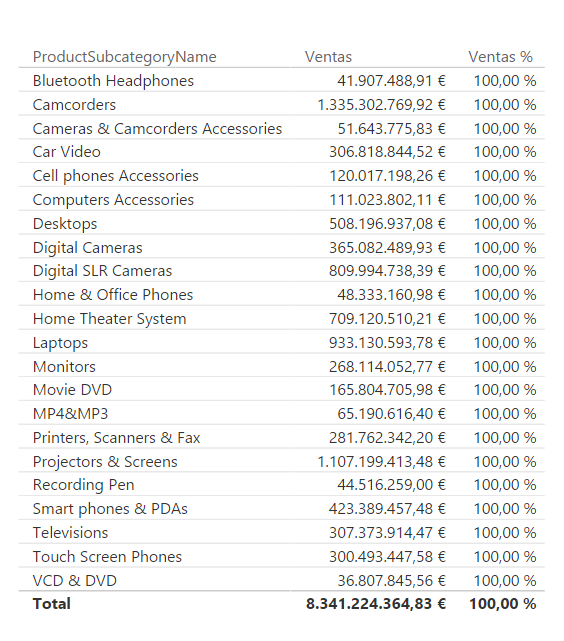
...would be, obviously, useless, since the denominator of the division would also adapt to the context and would only add the records affected by it, so that both the numerator and the denominator would return the same value. Including this measure in the previous table we would obtain an erroneous result:
The only way to perform this calculation correctly would be to make sure that the total sales represented by the denominator (SUM(FactSales[SalesAmount]) in the example above) includes all the rows in the table. To calculate the total sales, we can use the SUMX function, including the sales table, FactSales, as the first argument, after eliminating the existing filters:
SUMX(ALL(FactSales), FactSales[SalesAmount])
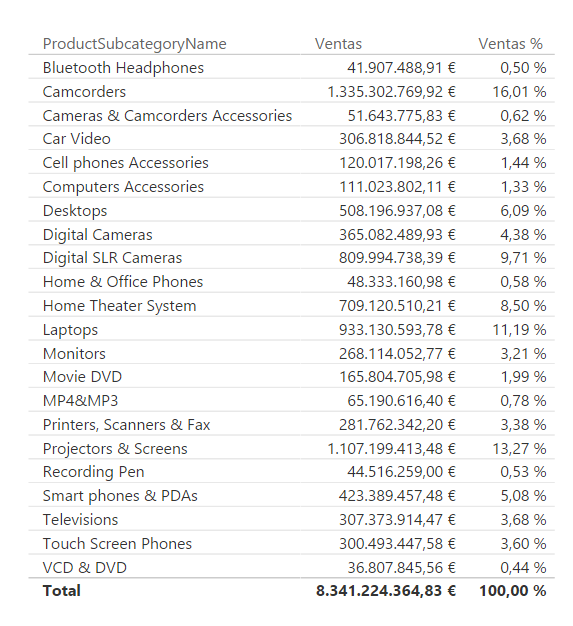
This calculation will return the total sales regardless of the context in which it is applied. Now we can define a measure that calculates the percentage represented by each figure with respect to the total:
Ventas % = DIVIDE(
[Ventas],
SUMX(ALL(FactSales), FactSales[SalesAmount])
)
...resulting:
Continuing with the data set from the previous example, we could put the sales by subcategory and year into a matrix:
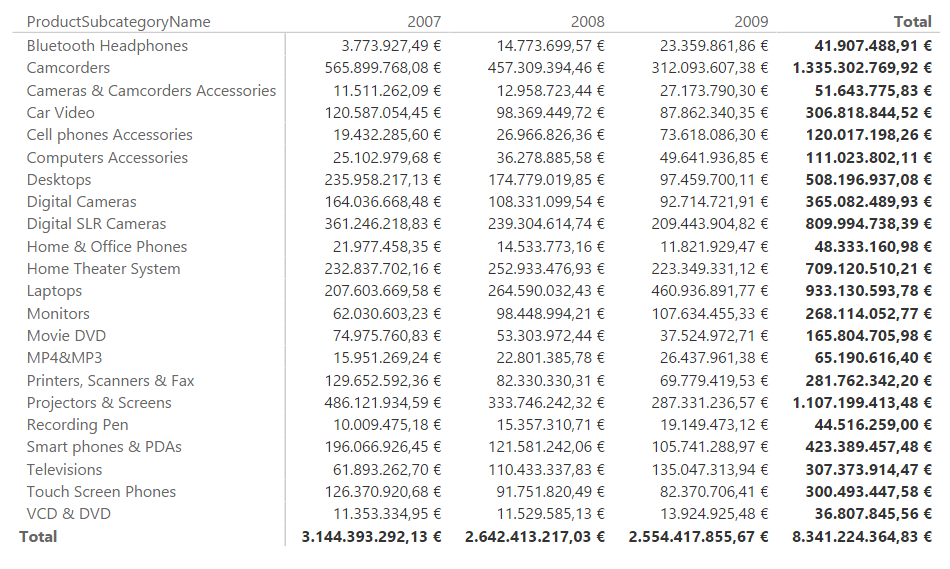
If we now wish to show, next to each figure, the percentage it represents with respect to the sales of the year (not with respect to the total), we should be able to calculate the denominator involved in the calculation that would result from adding the sales for the year indicated by the context but including all subcategories.
To do this we can start from the [Ventas] measure already created (which simply adds the values of the SalesAmount column once the context is considered) but making sure that we eliminate the possible filter that is being applied to the subcategories, for which we resort to the CALCULATE function :
Ventas año = CALCULATE(
[Ventas],
ALL(DimProductSubcategory[ProductSubcategoryName])
)
The result of this calculation will be the sum of sales (in context) but imposing as a filter the condition that all subcategories are considered.
Now we could calculate the percentage that each figure represents with respect to the total for the year:
Ventas Categoria % = DIVIDE(
[Ventas],
[Ventas año]
)
Resulting:
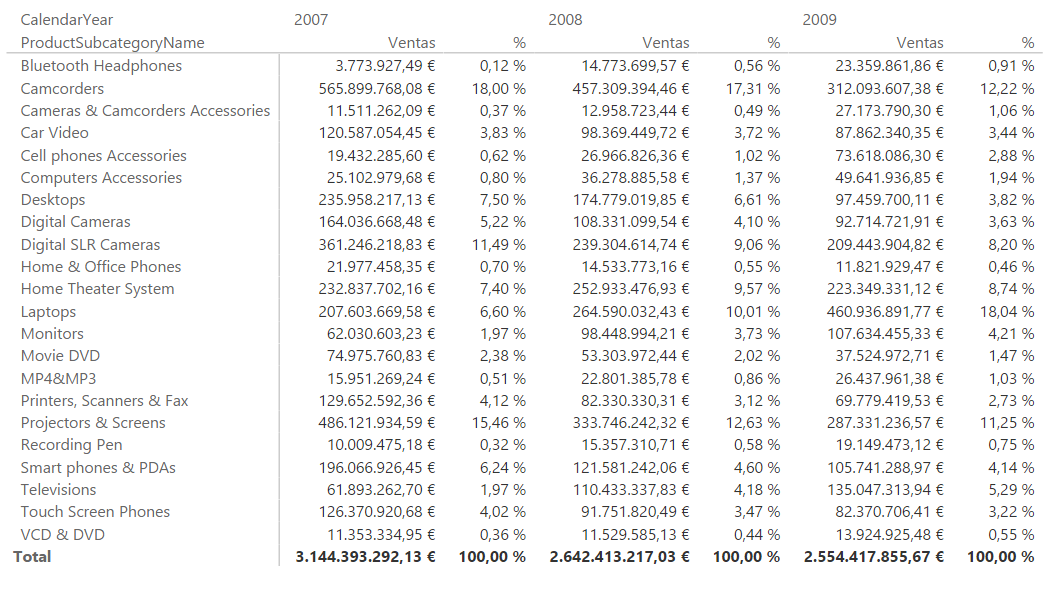
(totals columns have been removed to improve display)
The Geography table includes information on hundreds of geographic points spread over 6 countries. For each of them there is information not only about the country to which it belongs, but also the region, city and postal code. This means that a given country, Australia, for example, will appear dozens of times in the Country column of that table (once for each of the points located in this country):
![Geography [Country] field](/sites/default/files/inline-images/dax_function_all_06.png)
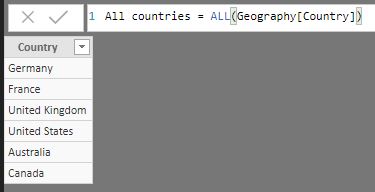
Now if we use the ALL function on the Geography[Country] column, the result is not a table containing the same column after eliminating the filters: it is a table containing the column once the repeated values have been eliminated:
All countries = ALL(Geography[Country])
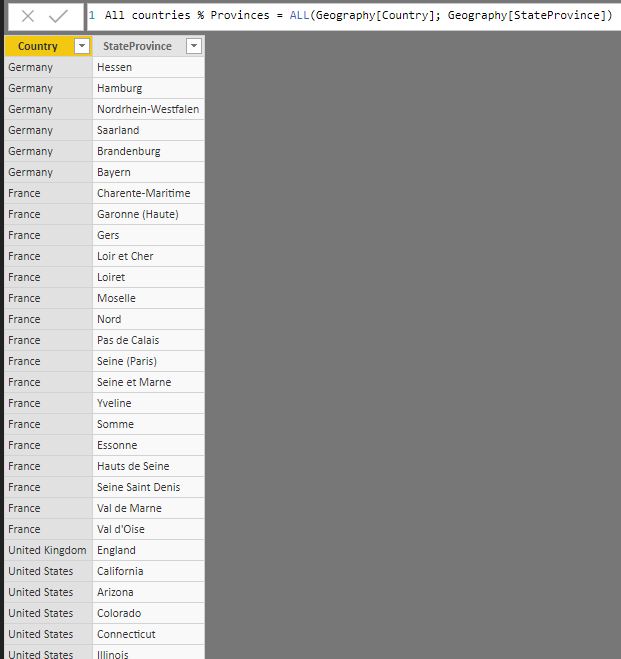
Continuing with the same example, if the ALL function is applied to two fields in the Geography table, for example Country and StateProvince, the result will be a table containing all the existing combinations of both fields (each combination appearing only once):
All countries % Provinces = ALL(Geography[Country], Geography[StateProvince])