The HASONEVALUE function returns the logical value True when the context has reduced the number of distinct values in the column indicated as an argument to one, and the logical value False in any other case.
HASONEVALUE(
columnName
)
- columnName: Name of a column. It cannot be an expression.
The HASONEVALUE function returns a Boolean.
The function analyzes how the context affects the column indicated as an argument. If that has reduced the number of different values or elements in the column to a single value, the function returns True. If the column holds a different number of unique values (zero or more than one), it returns False. This function is therefore equivalent to:
COUNTROWS(VALUES(columnName)) = 1
Given a sales table, we define the following measure that calculates the total sales:
Ventas = SUM(FactSales[SalesAmount])
If we take the list of categories (their code, in this example) and subcategories together with the associated sales to a matrix, the result is the following:

Now suppose that we want to indicate the percentage that the sales of each subcategory represent with respect to the total. With this objective we define the following measure:
Ventas totales = CALCULATE(
[Ventas],
ALL(DimProductSubcategory[ProductCategoryKey]),
ALL(DimProductSubcategory[ProductSubcategoryName])
)
(measure that, as it is defined, will be independent of the context regarding categories and subcategories).
To show the percentage that sales represent with respect to the total, we now define the corresponding measure:
% ventas = DIVIDE([Ventas], [Ventas totales])
If we add this measure to the previous matrix we obtain:
But it has been commented that we are only interested in the percentage for the subcategories, not for the category totals or for the grand total. For the calculation of the sales column or the percentage, the context reduces the column "ProductSubcategoryName" to 1) a single element (in those cases in which the calculation is counting the sales of a specific subcategory), 2) to all subcategories within one category (in category totals) or 3) to all existing subcategories (in grand total calculation). It is this information that is analyzed by the HASONEVALUE function. We are therefore going to modify the measure that calculates the percentage of sales as follows:
% ventas = IF(
HASONEVALUE(DimProductSubcategory[ProductSubcategoryName]),
DIVIDE([Ventas], [Ventas totales]),
BLANK()
)
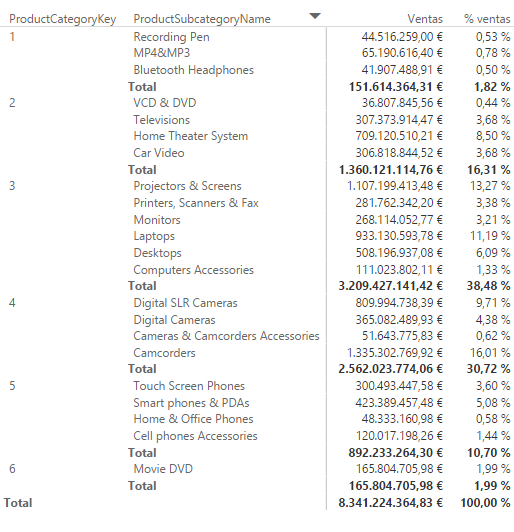
The condition evaluated in the IF function is precisely whether the DimProductSubcategory[ProductSubcategoryName] column is reduced -due to the context- to a single value or not. As mentioned, when it is reduced to a single value, it will be because the calculation corresponds to the sales of a single subcategory. And when it is not reduced to a single value it will be because a total (of category or the grand total) is being calculated. With this new definition of the [% ventas] measure, the matrix looks like this:

...which shows the percentage only for the subcategories, just as we wanted.