Full name
statistics.NormalDist.overlap
Library
statistics
Syntax
statistics.NormalDist.overlap(other)
Description
The overlap method of an object of type statistics.NormalDist takes as an argument another distribution of the same type and returns a real value between 0.0 and 1.0 representing the overlapping area for both distributions.
Parameters
- other: Distribution with which to compare the distribution to which the method is applied.
Result
The statistics.NormalDist.overlap method returns a real number between 0.0 and 1.0.
Examples
If we start from the following two distributions:
dist1 = statistics.NormalDist(mu = 3, sigma = 3)
dist2 = statistics.NormalDist(mu = 7, sigma = 1)
dist2 = statistics.NormalDist(mu = 7, sigma = 1)
...we can generate a hundred thousand random samples for each one and display their histograms:
import matplotlib.pyplot as plt
plt.subplots(figsize = (9, 5))
plt.hist(dist1.samples(100000), bins = 100, alpha = 0.6)
plt.hist(dist2.samples(100000), bins = 100, alpha = 0.6, color = "lightgreen")
plt.grid()
plt.show()
plt.hist(dist1.samples(100000), bins = 100, alpha = 0.6)
plt.hist(dist2.samples(100000), bins = 100, alpha = 0.6, color = "lightgreen")
plt.grid()
plt.show()
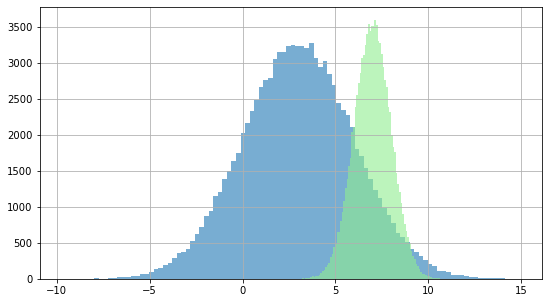
It can be seen visually that both distributions overlap. If we wanted to calculate the area covered by both distributions we could do it with the following code:
dist1.overlap(other = dist2)
0.256832360832715